Cost Analysis with Pareto Chart: A Practical Tool for Smarter Financial Decisions
In today’s fast-paced and data-driven world, understanding where your money goes is more important than ever. Whether you're managing a personal budget or overseeing business expenses, identifying the most significant cost drivers can lead to better financial planning and strategic decision-making. That’s where Cost Analysis with Pareto Chart comes in—a powerful method rooted in the 80/20 rule that helps you focus on what truly matters.
What Is Cost Analysis with Pareto Chart?
The Cost Analysis with Pareto Chart is a technique used to prioritize and categorize costs based on their impact. It relies on the Pareto Principle, also known as the 80/20 rule, which suggests that 80% of effects come from 20% of causes. In financial terms, this means that a small number of cost factors often account for the majority of your total expenses.
By visualizing these cost distributions through a Pareto Chart, you can quickly spot which areas require attention. This approach not only simplifies complex data but also provides actionable insights for reducing waste, optimizing spending, and improving overall efficiency.
Why It Matters in Modern Workflows
As remote work, digital tools, and automation become standard in both personal and professional settings, there's a growing need for accessible, intuitive financial analysis solutions. The Cost Analysis with Pareto Chart Template fits perfectly into this landscape by offering a user-friendly way to track and manage expenses without requiring advanced technical skills.
For entrepreneurs, freelancers, and small business owners, this tool can help streamline budgeting processes and ensure that limited resources are allocated effectively. For creatives and educators, it offers a structured way to monitor project-related costs and maintain financial control over income and expenditures.
How the Template Works
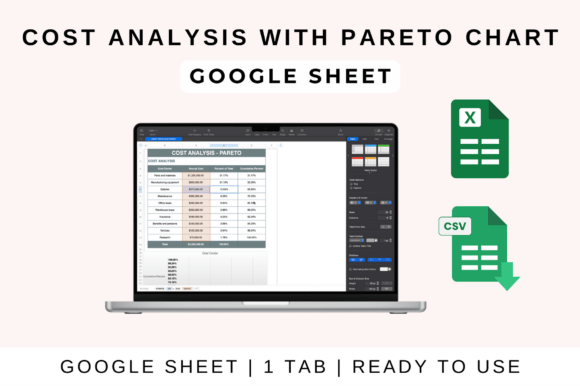
The Cost Analysis with Pareto Chart Template is designed to be both functional and easy to use. It allows users to input income and expense data, automatically calculates totals, and generates a visual representation of cost distribution using a Pareto Chart. This makes it simple to see which categories contribute the most to your overall costs.
Here’s a quick overview of how to get started:
- Open the File: Upload the template to Google Drive and open it in Google Sheets, or download the Excel version for desktop use.
- Enter Your Data: Input income and expenses under the appropriate categories. This could include things like rent, utilities, software subscriptions, marketing costs, and more.
- Automated Calculations: The spreadsheet will automatically update totals, profit, and loss, giving you real-time financial insights.
- Customize as Needed: Adjust categories, formulas, and visuals to match your specific needs and preferences.
- Share Collaborate: Easily share the sheet with your team for real-time updates and collaboration.
This level of automation and customization makes the template ideal for users who want to save time while maintaining control over their finances.
Practical Implications for Different Users
Whether you’re a business owner, a freelancer, or someone managing a household budget, the Cost Analysis with Pareto Chart can provide valuable insights. For example:
- Business Owners: Identify which operational costs are having the biggest impact on profitability and make informed decisions about where to cut back or invest.
- Freelancers: Track project expenses and compare them against income to determine which clients or projects are the most profitable.
- Household Budgeters: Discover which recurring expenses—like groceries, subscriptions, or utilities—are taking up the largest portion of your monthly budget.
These practical applications make the template a versatile tool that can be adapted to various financial scenarios and goals.
Evolution of Cost Management Tools
Over the years, cost management has evolved from manual spreadsheets to sophisticated software solutions. However, many of these tools can be overwhelming for users who don’t have a background in finance or data analysis. The Cost Analysis with Pareto Chart Template bridges this gap by offering a streamlined, no-code approach to financial tracking.
As more people embrace digital tools for personal and professional organization, the demand for intuitive, customizable solutions continues to grow. This trend aligns with the increasing preference for cloud-based platforms like Google Sheets and Excel, which allow for seamless collaboration and accessibility across devices.
Realistic Examples and Recommendations
Consider a small online business owner who uses the Cost Analysis with Pareto Chart Template to evaluate monthly expenses. By inputting data on website hosting, advertising, and software costs, they discover that 80% of their expenses are concentrated in just two categories: domain hosting and social media ads. This insight leads them to explore alternative hosting providers and refine their ad strategy, resulting in significant cost savings.
Another example might be a freelance graphic designer who uses the template to track project-related costs. They find that a large portion of their expenses goes toward design software and stock image subscriptions. With this knowledge, they decide to switch to more affordable alternatives or negotiate better rates with their service providers.
These examples highlight how the template can be used to make informed decisions that directly impact financial health and long-term sustainability.
Conclusion
The Cost Analysis with Pareto Chart is more than just a financial tool—it’s a mindset shift that encourages users to focus on the most impactful aspects of their spending. By leveraging the 80/20 rule, individuals and businesses can gain clarity, reduce unnecessary expenses, and make smarter financial choices.
With its ease of use, compatibility with major spreadsheet platforms, and built-in features for data visualization and analysis, the Cost Analysis with Pareto Chart Template is a valuable resource for anyone looking to take control of their finances. Whether you're managing a small business, running a creative project, or simply trying to stick to a budget, this tool can help you achieve greater financial awareness and confidence.